In order to target help where it is needed, it is useful to be able to compare a child’s score on a language assessment with other children. If the child’s understanding is behind that of other children then it may be that some support is required. Age can get in the way of making this comparison. Children develop at different rates and older children are expected to have acquired more skills in a given area.
What is a Standard Score?
This is where a standard scale can help. If there are 40 prompts in a language screen, it might be that on average a five year old gets 19 of them correct but a six year old might on average get 33 correct. On a standard scale we take the average raw (actual) score and we give it a nominal value of 100. Then we know immediately that a five year old scoring 100 and a six year old scoring 100 have both got the average score for their age, even though their actual scores are different. If they were both to have a standard score of 110, then they would both be the same amount above the mean for their respective ages.
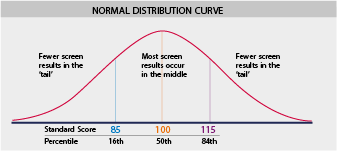
If the assessment or screen is well designed then all the scores plotted together will have a characteristic distribution, this is called the ‘normal’ distribution. We can use the fact this distribution is well understood and described mathematically to say more about a score on our standard scale.
We can make our standard scale work so that a score of 85 or less is in the lower 16 percent of scores. This is often taken as the threshold for some type of support being needed. A score of 115 or more is higher than 84 percent of other scores.
What is Standard Deviation?
The standard scale we are describing has a mean of 100 and a value called the ‘standard deviation’ is set to 15. A standard deviation measures how spread out the scores are around the mean and an individual one is calculated for the actual scores for each age; this is defined as 15 on the standard scale. We could decide on different figures for the standard score mean and standard deviation. As long as we calculate the real mean and standard deviation for the real scores at a given age, then we can map the scores to our standard scale whatever we choose it to be. This allows us to compare scores between children of different ages more sensibly and children are not missed because of their age. A screening tool or assessment created in this way is said to be ‘age-standardised’.
What are Percentiles?
Related to standard scores is the idea of percentiles. At a given percentile, say P, the score is greater than or equal to P percent of other scores. For example, a percentile of 72 means the score is equal to or greater than 72% of other scores. The mean standard score, 100 on the scale we described, is equivalent to the 50th percentile. If the standard deviation is 15 then a score of 85 is the 16th percentile and a score of 115 is the 84th percentile.
Please login to view this content
Login